Introduction
APIs (Application Programming Interfaces) are the glue of modern web and mobile applications. They connect services, enable integrations, and allow communication between different parts of your system. Whether you're managing a small web app or an enterprise-level platform, ensuring that your APIs are fast, reliable, and efficient is critical to success.
In this blog, we’ll walk you through how to monitor, analyze, and optimize your API performance—ensuring seamless user experiences and scalable systems.
Why API Performance Matters
APIs power the digital world. From fetching data on a weather app to completing a payment transaction, APIs must function flawlessly. A delay of even a few hundred milliseconds can:
Frustrate users
Increase bounce rates
Reduce customer satisfaction
This leads to revenue loss
That’s why maintaining high API performance isn't just a technical goal—it’s a business necessity.
1. How to Monitor API Performance
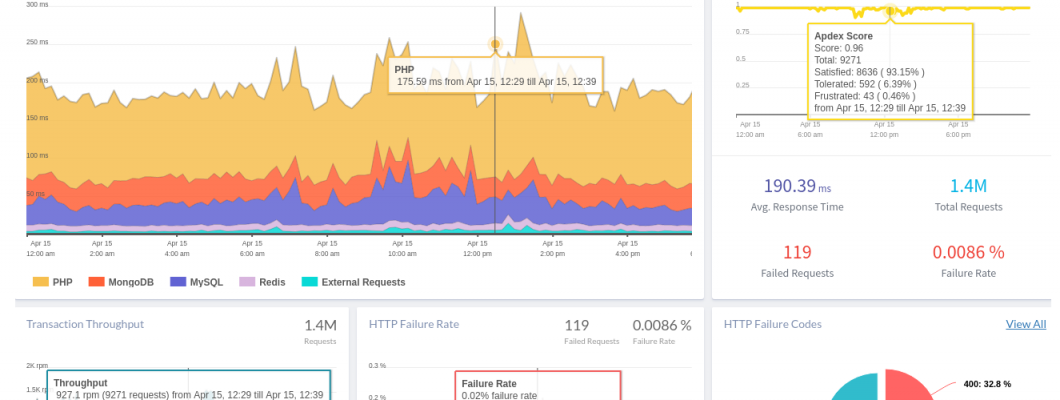
Key Metrics to Track
Monitoring starts with measuring the right metrics:
Latency: Time taken from sending a request to receiving a response.
Throughput: Number of requests processed per unit time (requests/second).
Uptime: Availability of your API endpoints (usually measured in %).
Error Rate: Percentage of failed requests (e.g., 4xx, 5xx responses).
CPU & Memory Usage: Important for resource optimization on your API server.
Top API Monitoring Tools
Postman Monitors: Automates testing and uptime checks.
Datadog: Full-stack observability with real-time API monitoring.
New Relic: Monitors performance bottlenecks and transaction traces.
Pingdom: Uptime and availability tracking.
Prometheus + Grafana: Ideal for custom, self-hosted monitoring with powerful dashboards.
Best Practices
Set up real-time alerts for high latency, downtime, or error spikes.
Monitor both internal and third-party APIs on which your app depends.
Track metrics over time to identify performance degradation trends.
2. How to Analyze API Performance
Once you're collecting data, it’s time to interpret it.
Analyze Usage Patterns
Look into:
Peak hours and traffic spikes
Frequently accessed endpoints
Unusual traffic sources or volumes
Identify Bottlenecks
Use logs and metrics to find:
High-latency endpoints
Repeated failed requests
Slow third-party dependencies
Use Logs for Root Cause Analysis
Combine logs from tools like ElasticSearch, Loggly, or Splunk to:
Trace request paths
Pinpoint errors and failures
Find unauthorized access attempts
Segment Analysis
Group data by:
User device or region
Request type (GET, POST)
Version (v1 vs. v2 APIs)
This gives deeper visibility into performance across use cases.
3. How to Optimize API Performance
After identifying issues, here are steps to make your APIs faster and more efficient.
Implement Caching
Reduce repeated processing by caching:
API responses using Redis or Memcached
Database query results
Static content
Use HTTP cache headers (ETag, Cache-Control) to control browser-side caching.
Optimize Database Queries
Many API slowdowns are caused by poor database performance. Ensure:
Indexes are used properly
Queries are optimized
Database connections are pooled
Use Pagination
Large payloads can slow down your API. Instead of sending all results at once, paginate using:
JSON
CopyEdit
GET /users?page=1&limit=50
Asynchronous Processing
Move long tasks (file processing, email sending) to background jobs using:
Celery
Sidekiq
AWS SQS
Implement Rate Limiting
Prevent abuse and control traffic with tools like:
NGINX rate limiting
API Gateway (e.g., AWS, Azure, Kong)
Choose the Right Protocol
Sometimes switching from REST to GraphQL or gRPC improves performance by:
Reducing over-fetching
Compressing payloads
Enabling efficient streaming
4. Test Regularly for Continuous Improvement
Just monitoring is not enough. Testing helps prepare for real-world conditions.
Load Testing Tools
Apache JMeter
k6
Artillery
Locust
Simulate thousands of concurrent users and monitor how your API performs under pressure.
CI/CD Integration
Include performance tests in your CI/CD pipeline to:
Catch regressions early
Automate testing during deployments
Ensure consistent API health
5. Secure Your API While Optimizing
Performance without security is risky. Protect your APIs with:
HTTPS to encrypt data
Authentication tokens (OAuth2, JWT)
Input validation to prevent injection attacks
Access controls to protect sensitive data
Don't expose unnecessary data just to improve speed.
Conclusion
Monitoring, analyzing, and optimizing API performance is a continuous process. With the right metrics, tools, and strategies, you can ensure your APIs are:
Fast and responsive
Scalable under high load
Reliable across environments
Secure and trusted
In an interconnected digital world, robust APIs aren’t optional—they’re essential.

Leave a Comment